Defense & Military
Pentagon Implements Rapid Response Unit To Monitor Wind Farm Dashboards Amid Regional Conflict
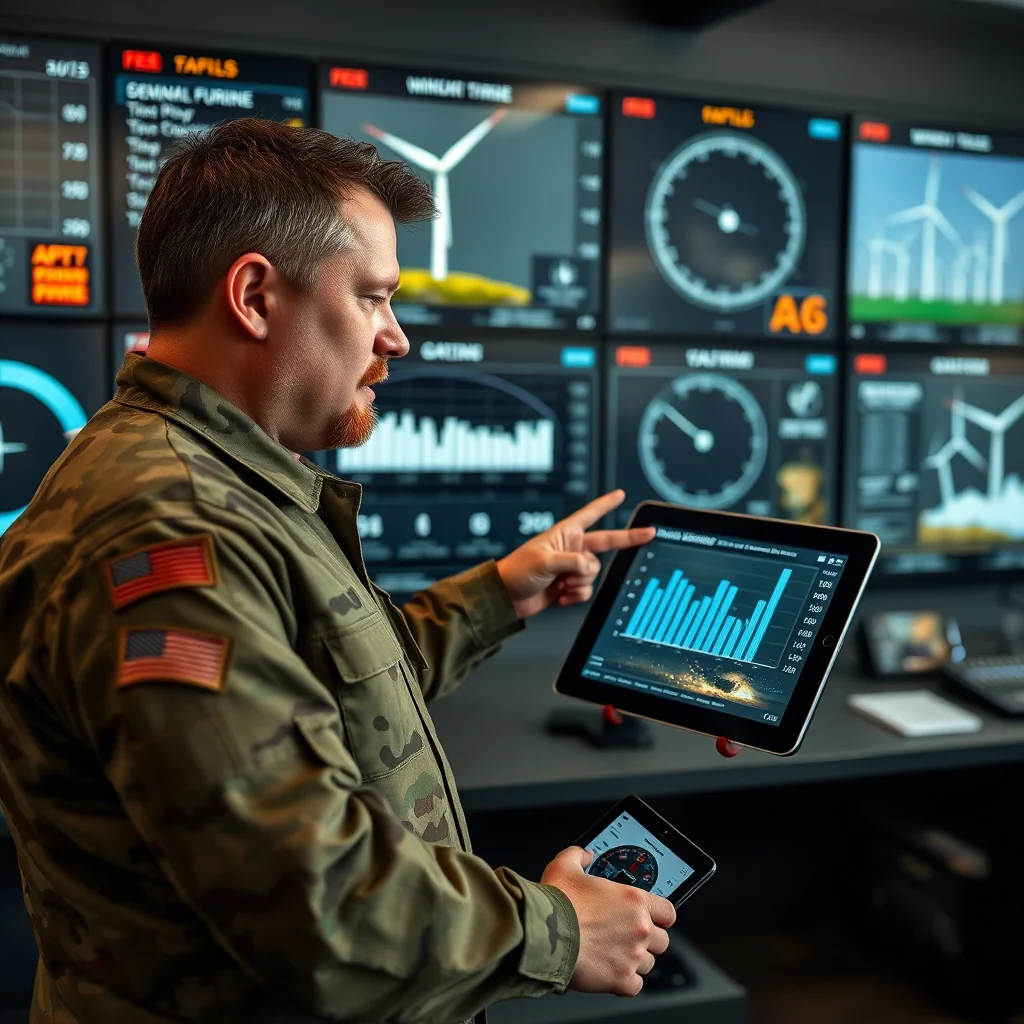
WASHINGTON—In what defense officials are calling a landmark fusion of energy infrastructure management and military doctrine, the Pentagon has established a Rapid Dashboard Response Unit (RDRU) tasked exclusively with stabilizing renewable energy monitoring systems during combat operations. The initiative comes as U.S. and Israeli airstrikes continue to bombard targets in Iran and Lebanon, creating electromagnetic interference that causes wind farm dashboards across the region to display erratic data visualizations.
'The synchronization of our tactical operations with critical energy analytics represents a generational leap in defense strategy,' Defense Secretary Pete Hegseth told reporters from a secure briefing room where live feeds from portable tablets showed flickering wind turbine performance metrics. 'While some might focus solely on munitions expenditure, we're equally committed to ensuring that our allied energy partners can accurately monitor capacity factors during peak conflict hours.'
The RDRU—composed of 47 civilian contractors, data visualization specialists, and three military liaisons—operates from a modified operations trailer parked strategically between a forward operating base and a 200-turbine wind farm in northern Israel. Their primary mission: maintain dashboard uptime despite the electromagnetic pulses generated by nearby airstrikes.
'We've established a color-coded alert system specifically for visualization anomalies,' said unit director Arlan Moss, pointing to a whiteboard covered in redline code tracking everything from pie chart distortions to legend misalignments. 'A Level 1 anomaly might involve minor label overlapping, while a Level 4 constitutes complete gauge separation from their numeric values. We haven't had to declare a Level 5 yet—that's when the charts actually start displaying inverse relationships to reality.'
According to internal documents obtained by The Guardian, the unit's performance is measured through a newly created metric called 'Visual Coherence Under Duress' (VCUD). The metric assigns points based on how long dashboard elements remain properly aligned during bombardment cycles, with bonus points awarded for maintaining aesthetic consistency across multiple device types.
'Last Tuesday was particularly successful,' Moss noted, reviewing performance data on a thermal imaging tablet that occasionally flashed 'ERROR' in bright red letters. 'We achieved 94% VCUD during a 30-minute sortie that targeted three suspected weapons facilities. The bar charts wobbled but never fully lost their proportional integrity.'
Military strategists have embraced the new approach with surprising enthusiasm. 'This represents a fundamental shift in how we conceptualize theater dominance,' said General Mark Milley during a video conference from an undisclosed location, his image occasionally pixelating as nearby explosions disrupted satellite uplinks. 'It's not enough to simply destroy enemy assets—we must also preserve the legibility of our allies' renewable energy monitoring systems. These dashboards are the front line of our commitment to sustainable warfare.'
The unit's work has not been without challenges. During what staffers now refer to as 'The Great Tooltip Incident,' a particularly powerful airstrike caused all hover-activated information boxes on a key dashboard to permanently display incorrect capacity figures. 'We had teams working around the clock to recalibrate the tooltip algorithms,' recalled senior analyst Chloe Richter, gesturing toward a whiteboard covered in complex trigonometric equations. 'For six hours, every turbine appeared to be operating at negative efficiency. The emotional toll on the monitoring staff was... not insignificant.'
Ironically, the electromagnetic interference causing the dashboard issues has simultaneously created unexpected opportunities for the response team. 'We've discovered that the glitching patterns actually create a unique fingerprint for different types of munitions,' Richter explained, showing a series of waveform analyses that correlated specific dashboard artifacts with particular aircraft and payload combinations. 'The F-35s produce a distinctive radial chart oscillation, while the B-52s cause more of a sweeping gauge needle effect. We're considering publishing a field guide.'
Back in Washington, congressional oversight committees have begun questioning the resource allocation. 'We're spending $4.2 million monthly to ensure that green energy infographics remain readable while we drop bombs,' said Representative Jamie Raskin during a House Armed Services Committee hearing. 'I'm not certain this represents the most efficient use of defense appropriations.'
Defense officials countered that the dashboard stabilization effort has yielded unexpected intelligence benefits. 'We recently identified an attempted cyber intrusion solely because the attack signature created a unique bar chart animation that our team recognized as anomalous,' a Pentagon spokesperson claimed, displaying before-and-after screenshots of a turbine performance dashboard. 'The hackers tried to mask their activities as routine electromagnetic interference, but they failed to replicate the specific gradient fade that occurs during legitimate airstrikes.'
As the conflict enters its third week, the RDRU has expanded its mandate to include predictive modeling of dashboard behavior. 'We can now forecast with 87% accuracy which visualization elements will fail first during different intensity bombings,' Moss said, proudly demonstrating a prototype gadget held together with tape that allegedly predicts pie chart segmentation errors. 'Next quarter, we hope to achieve similar predictability for scatter plot clustering anomalies.'
The unit's success has inspired similar initiatives across other government agencies. The Department of Energy is reportedly developing a parallel program to maintain spreadsheet formula integrity during power grid fluctuations, while NASA has begun testing protocols for keeping mission control displays functional during solar flares.
Meanwhile, in the operations trailer buzzing with radios and the hum of portable generators, team members continue their meticulous work. Clipboards holding outage response plans sit alongside thermal imaging tablets glowing with hot spots—both literal and metaphorical. The dashboards glitch, stabilize, and glitch again, each fluctuation meticulously logged and analyzed.
'Some people see chaos,' reflected Moss, watching as a particularly violent explosion nearby caused every gauge on his primary monitor to simultaneously max out. 'We see an opportunity to refine our color saturation protocols.'
As the conflict escalates with both sides promising further surprises, one thing remains certain: America's commitment to readable data visualizations will not waver. The VCUD metric continues to trend upward, and defense contractors are already developing specialized electromagnetic shielding for next-generation dashboard interfaces. In the new calculus of modern warfare, chart clarity has become as strategically important as crater depth.
About the author